The Environmental Protection Agency (EPA) has developed an innovative application that enables users to access environmental and health indicators based on various factors such as income, location, and census data. This interactive data visualization app aims to provide vital information quickly and reliably to individuals, including community planners, regulators, and the general public.
The development of this app became possible due to EPA’s longstanding partnerships and collaborations with local and international organizations. Through discussions, educational webinars, and information exchanges, valuable insights were gained, leading to the creation of this user-friendly tool.
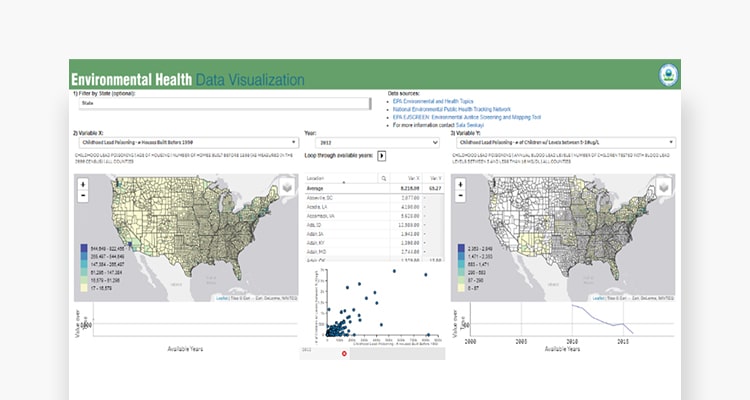
Known as the Regional Environmental Health Data Visualization Application (REHD), this app incorporates data on lead levels and counties with homes built before the 1950s. It visualizes the highest number of homes built before 1950 alongside the highest number of children tested with elevated blood lead levels between 5 and 10 µg/dL. The app includes year trends lines, sortable data tables, and maps highlighting counties with high values for each variable.
Dr. Bryan Chastain, an EPA contractor, played a crucial role in developing the REHD tool. With extensive experience in geospatial and data visualization applications, Dr. Chastain has received international recognition for his work. The app integrates health and environmental data from the Centers for Disease Control and Prevention (CDC) and the EPA’s Environmental Justice Screening and Mapping Tool, among other sources.
The Cherokee Nation also contributed to the app by providing lead paint data from 2011 to 2020. Collaborating with the app’s development team, the Cherokee Nation’s data was joined with other datasets, allowing for a comprehensive visualization of environmental health relationships. The REHD app showcases scatterplots illustrating the percentage of sampled homes testing positive for lead paint within Cherokee Nation counties, both indoors and outdoors.
The visualization capabilities of the REHD app aid in identifying data relationships and patterns. By presenting information through dynamic maps, scatter plots, and tables, the app offers a fresh perspective on environmental health information. This approach enables the identification of communities that may be disproportionately affected by pollution, contributing to efforts in environmental justice.
The app is continually being enhanced, with plans to incorporate additional datasets, compare results, and explore correlations. As more data becomes available, the REHD app will become increasingly valuable in understanding and addressing environmental health concerns. This exciting development signifies the EPA’s commitment to leveraging data for informed decision-making.
To explore the REHD app, please visit https://edap.epa.gov/public/extensions/EHD_public/EHD_public.html . For guidance on using the app, watch the instructional video: https://edap.epa.gov/public/extensions/EHD_public/Instruction%20Video%20Sound.mp4 for available on the EPA website.